Tracking sales is one thing. Understanding them is where the magic happens.
With this Google Analytics ThriveCart Integration guide to Google Analytics 4 reporting, you’ll unlock clear, actionable insights into every transaction – from GA4 metrics for revenue and tax to shipping metrics – and bring your data to life. Whether you’re building your first dashboard or refining your growth strategy, this ThriveCart Google Analytics 4 reports walkthrough arms you with the tools to turn raw numbers into smarter decisions that move your business forward.
Configure GA4 Ecommerce Dashboard
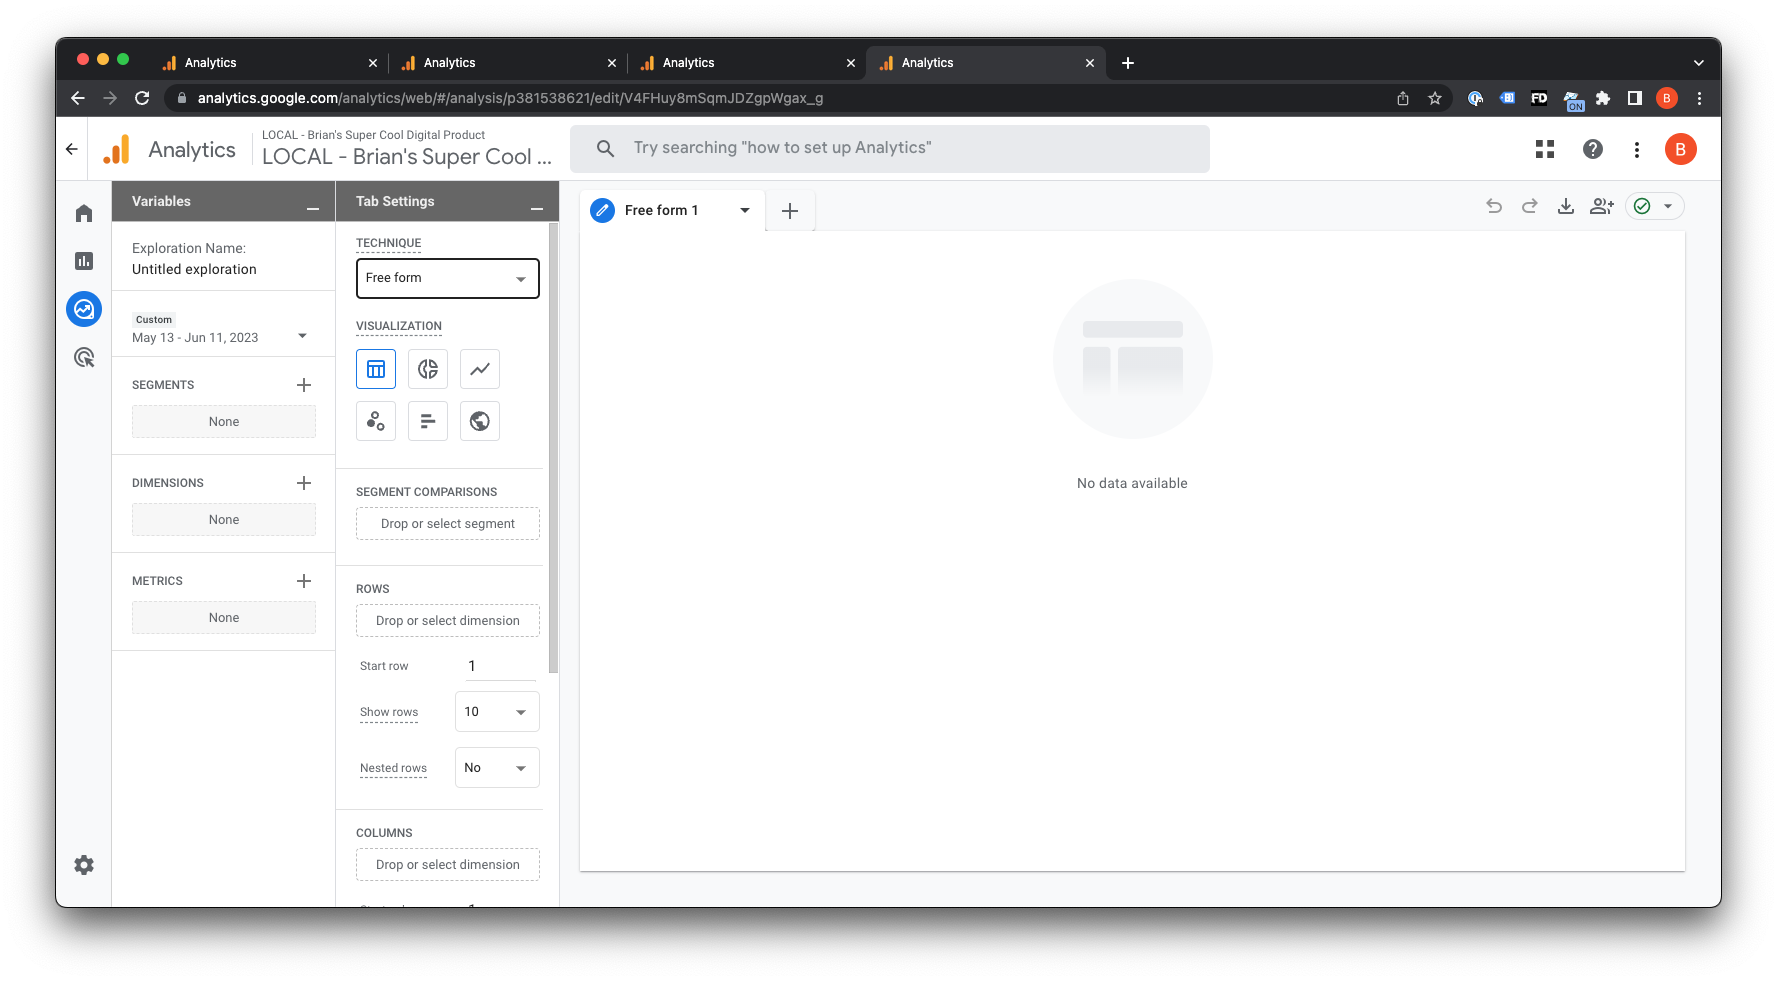
- Sign in to Google Analytics, click on the ‘Explore’ tab on the left-hand menu, and click the ‘+’ icon to create a new blank exploration.
- Leave the technique set to ‘Free form’.
- Click the + button in the Dimensions section, search for ‘Transaction id’, and check the box next to ‘Transaction ID’ under the ‘Ecommerce’ section.
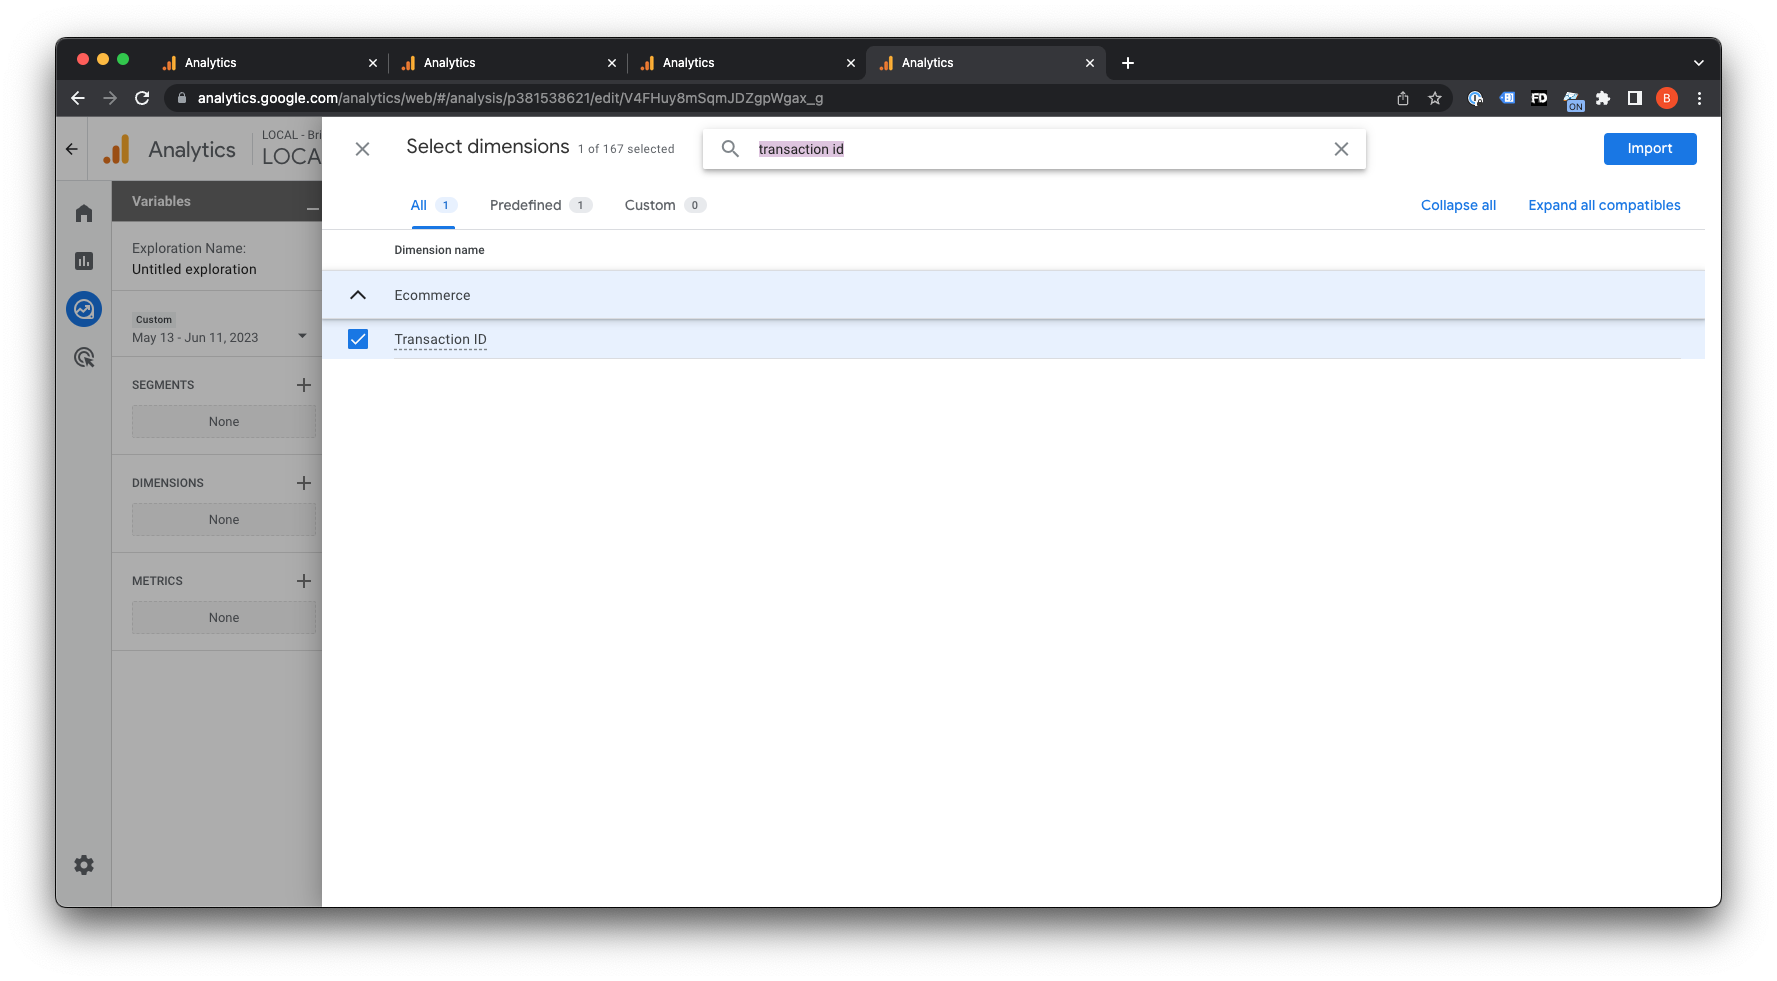
- Click the blue ‘Import’ button in the top-right corner to import the dimension.
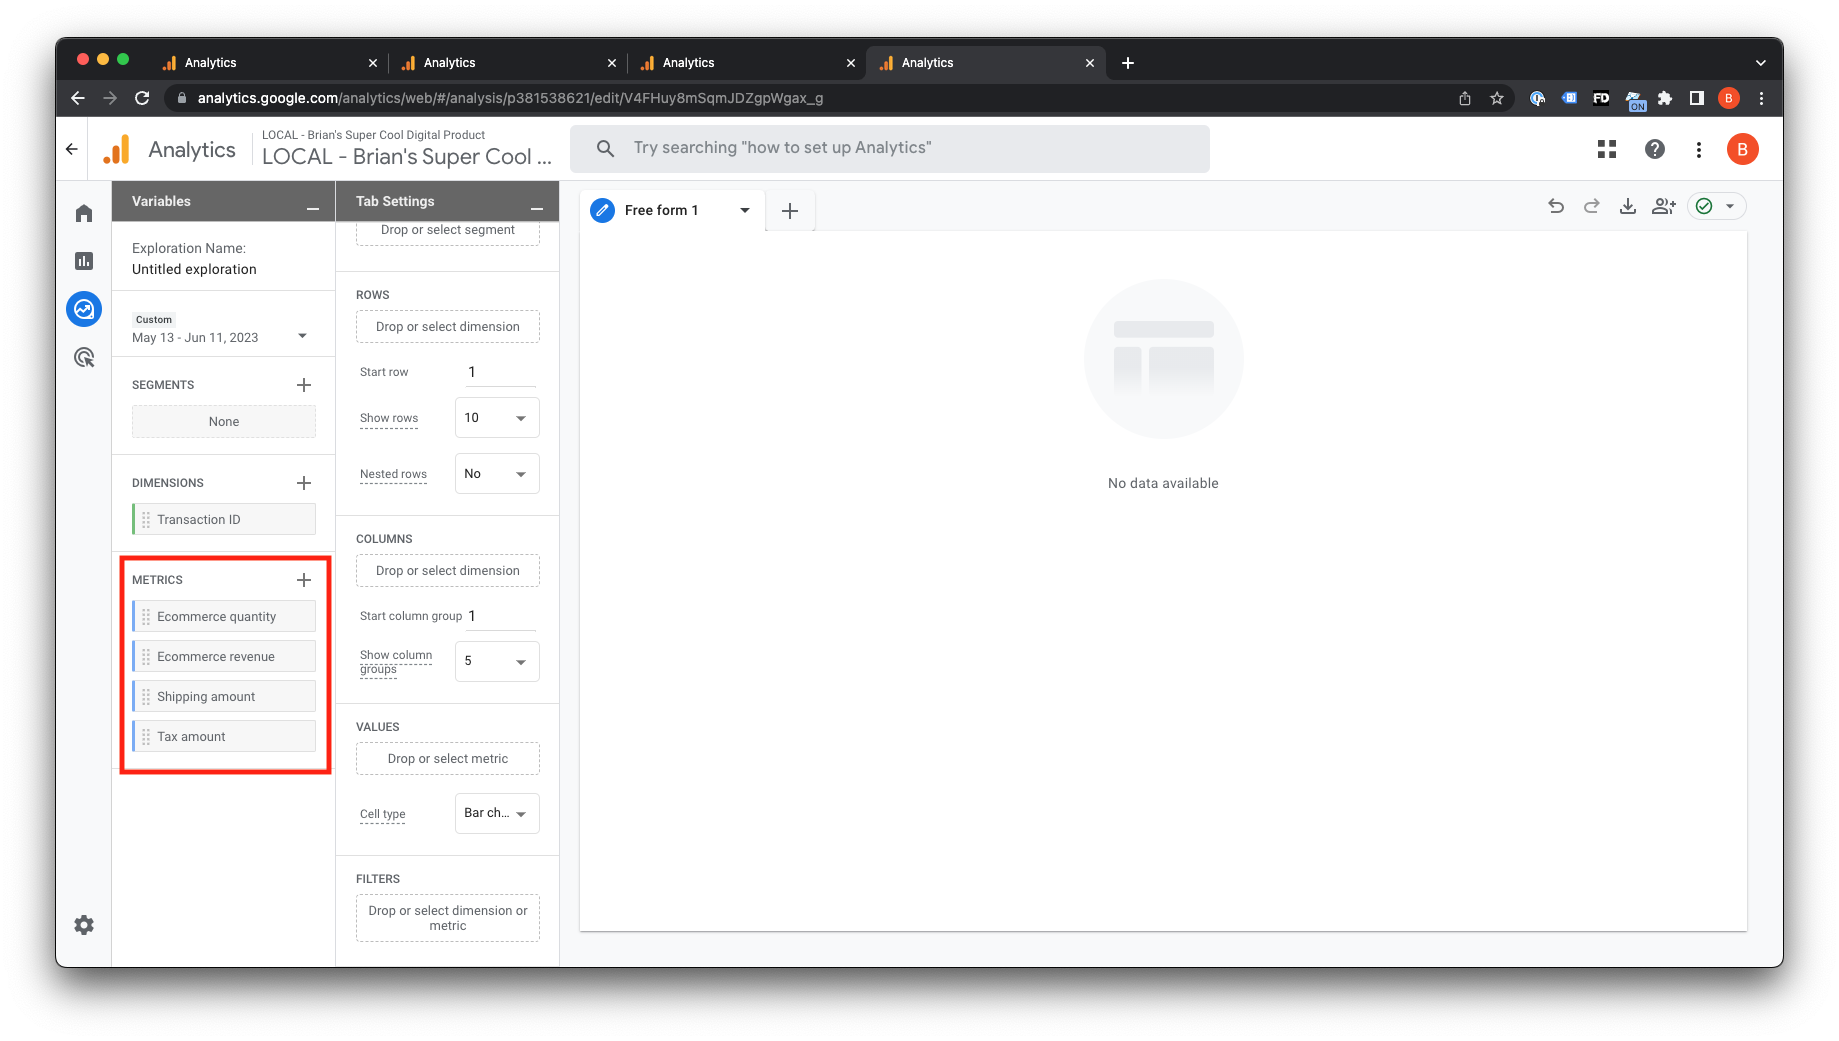
- Click the + button in the Metrics section, and select some metrics to add the the report – in this example, we will capture a Transactions report similar to what was available in Universal Analytics, so select ‘Ecommerce quantity’, ‘Ecommerce revenue’, ‘Shipping amount’, and ‘Tax amount’, and click the blue ‘Import’ button in the top right.
- You should now see these metrics available for use in the ‘Metrics’ section to the left.
- Drag and drop ‘Transaction ID’ from the ‘Metrics’ section and across into the ‘Rows’ section.
- Drag and drop the remaining metrics into the ‘Values’ section below.
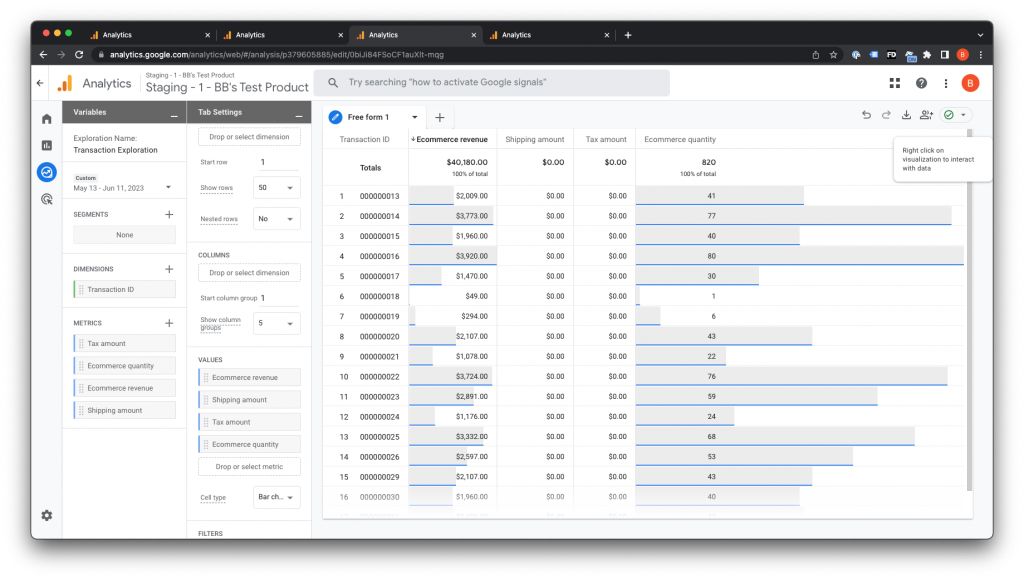
After up to 48 hours of reporting, your report will be populated out, and you will see a report of your revenue from ThriveCart similar to the screenshot below. You can use this report and these techniques to build out other dashboards and create custom reports in Google Analytics as needed.