Growth starts with clarity. Your ThriveCart Dashboard overview gives you a complete, real-time view of your business performance, all in one place. Whether you’re running a digital store, subscription service, or affiliate-driven business, your dashboard gives you instant insight into sales trends, recurring income, and revenue and refund reports, helping you make smarter, data-driven decisions.
With customizable reports, comparison tools, and visual breakdowns, ThriveCart turns your numbers into clear insights, so you can focus on optimizing growth instead of crunching data.
ThriveCart Dashboard at a Glance
Your ThriveCart Dashboard isn’t just a report; it’s a live performance monitor designed for growth. Every chart, filter, and metric is engineered to help you:
- Spot revenue trends early.
- Understand subscription behavior.
- Identify high-performing products and partners.
- Make informed, data-backed decisions.
Whether you’re managing a small digital shop or scaling a global subscription business, ThriveCart’s analytics give you the clarity and confidence to act fast and grow smarter.
When you log in to your ThriveCart account, you’ll be presented with your business insights dashboard, including a quick overview of today’s sales and revenue.

Your ThriveCart dashboard overview is divided into four key sections:
- Trends
- Revenue Breakdown
- Recurring Revenue analytics
- Refunds
The order of this data can be organized to your preference by clicking the ‘Customize Stats’ button at the top-right. Additionally, you can also compare 2 product funnels, by clicking the ‘Compare’ button.

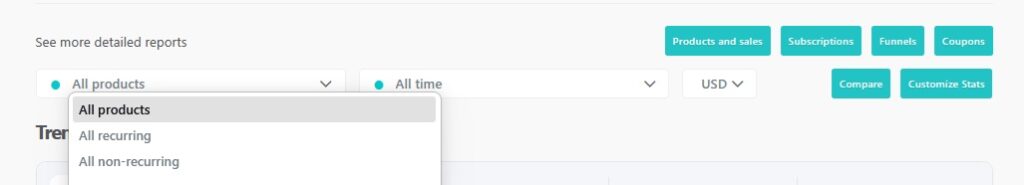
You can use the dropdown menu at ‘See more detailed reports’ so swap between All products, All recurring and All non-recurring.
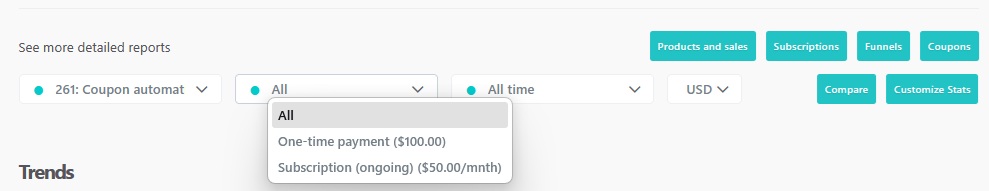
You can also filter recurring versus non-recurring revenue for a specific product by selecting a product in the ‘See more detailed reports’ dropdown menu. Then a new dropdown will appear with options to swap between All revenue, non-recurring and recurring revenue to help you better understand the revenue breakdown of each product by billing type.
All reporting under each section will be based on your product selection, time, and currency filters.
Trends
The trends area of your dashboard lets you see performance based on;
- Gross revenue – This is how much in sales you’ve processed.
- Net revenue – This is your Gross revenue, minus any refunds, commissions, sales tax, and shipping. Essentially how much you’ve retained (excluding any payment processor fees).
- Commissions paid – If you’re using ThriveCart’s Pro+ Affiliate or Partner Contracts system, then this will let you know how much you’ve paid out to your appropriate partners.
- Refund volume – If you’ve processed any refunds, how much you’ve processed will be noted here.
- Total Transactions (Previously named “Number of sales”) – The total of all payments, both newly placed orders and rebills.

Revenue Breakdown
The revenue breakdown section allows you to see a number of metrics that make up your gross revenue. The stacked bar chart will breakdown with different sections based on on different metrics and hovering your cursor over the chart will show you a tool tip.
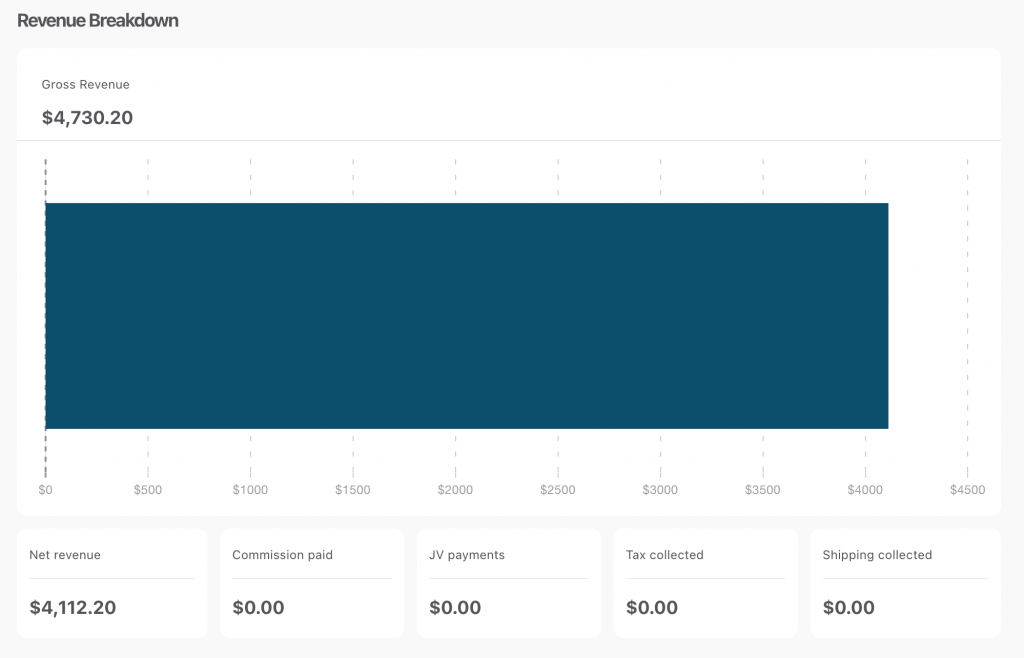
- Gross revenue – Same as in the Trends section, this is your total sales processed during the selected period.
- Net revenue – Same as in the Trends section, this is your Gross revenue, minus any refunds, commissions, sales tax, and shipping. Essentially how much you’ve retained (excluding any payment processor fees).
- Commissions paid – Same as in the Trends section, this will let you know how much you’ve paid out to your appropriate affiliates.
- JV Payments – Similar to the affiliate system, JV Contracts design for your business partners and sharing revenue. This stat confirms how much has been paid out to them.
- Tax collected – If sales have come from countries where sales tax was collected, the amount of tax you’ve collected will be shown here.
- Shipping collected – Finally, if you’re selling physical products and have charged customers shipping, how much in shipping revenue will be shown here.
This section helps you understand the full picture of your revenue flow, from gross income to net profit contributors.
Recurring Revenue Analytics
If you offer subscriptions or payment plans, the Recurring Revenue section gives you powerful insights into the health of your recurring income streams.
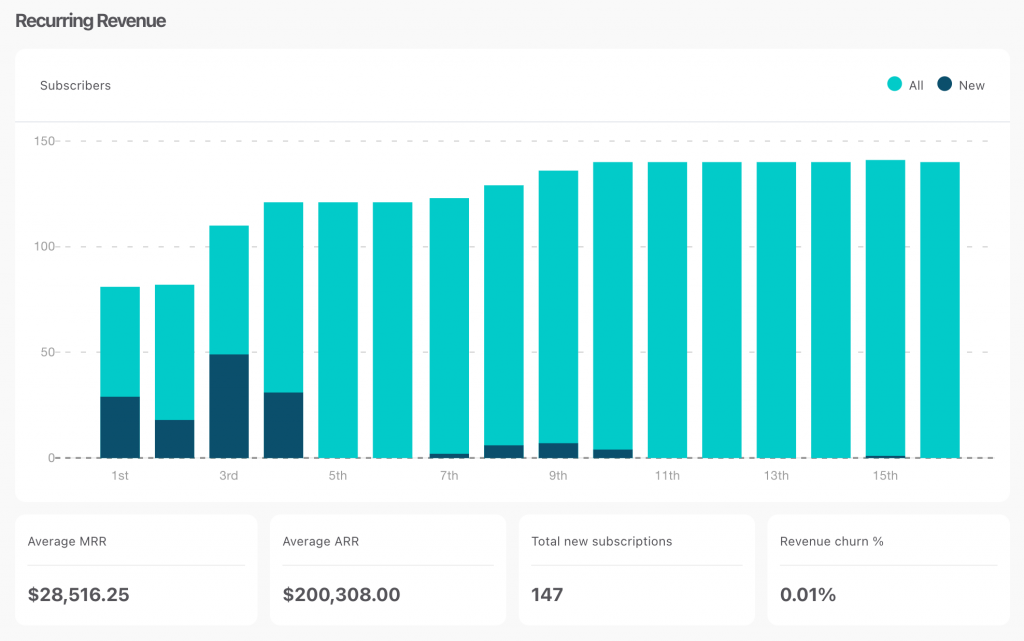
You’ll see a stacked bar chart showing both total and new subscribers for each time period. Hover over any bar to see individual data points.
Metrics include:
- Average MRR (Monthly Recurring Revenue): The average amount processed per month across all subscriptions.
- Average ARR (Annual Recurring Revenue): The average yearly recurring revenue.
- Total New Subscribers: Number of new subscriptions started in the selected timeframe.
- Revenue Churn %: The percentage of recurring revenue lost during the selected period due to cancellations or downgrades.
This section helps you spot growth opportunities, track subscription momentum, and assess the long-term sustainability of your business model.
Refunds
The Refunds section summarizes all refund activity within your selected date range, helping you monitor customer satisfaction and potential revenue leaks.
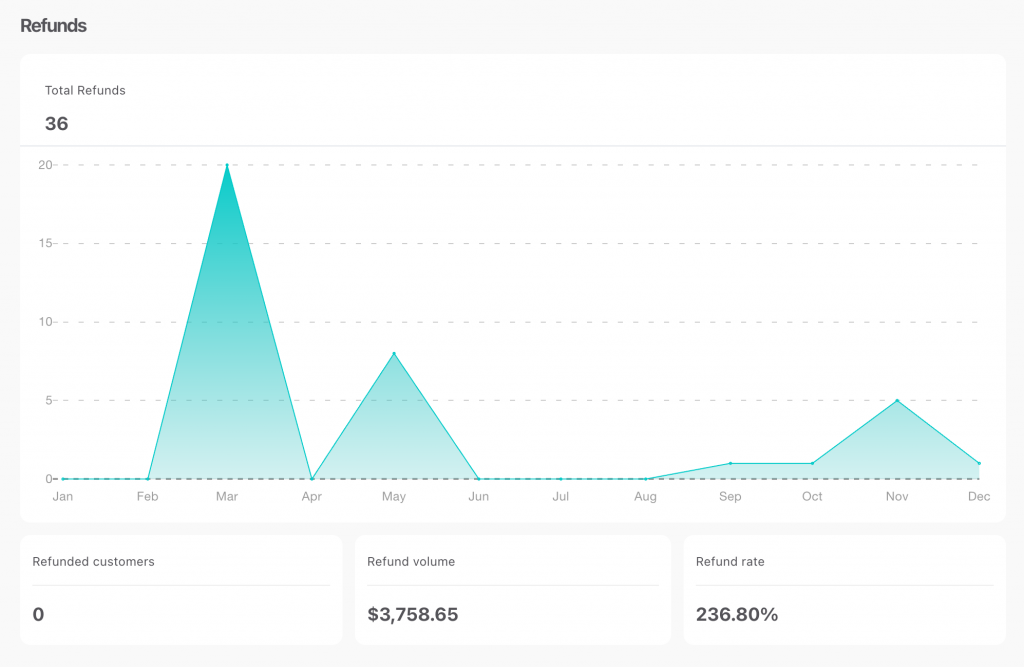
Metric include:
- Total refunds – This is how many refunds have been processed.
- Refunded customers – This is how many of your customers have been refunded.
- Refund volume – How much money has been refunded.
- Refund rate – The refund rate (note this can be higher than 100% as you may have processed more refunds in the time period than you have processed transactions).
By regularly reviewing this section, you can detect patterns, minimize refund rates, and maintain a healthy customer lifecycle.
Customization & Comparison Tools
- Customize Stats: Rearrange the order of dashboard sections to prioritize the metrics most relevant to your business.
- Compare Funnels: Quickly compare performance between two funnels or products to see which strategy or offer drives better results.
Frequently Asked Questions (FAQs)
- Q: Can I customize the order of dashboard sections?
- A: Yes! Use the Customize Stats button to reorder sections like Trends, Revenue Breakdown, Recurring Revenue, and Refunds to suit your needs.
- Q: How can I compare performance between products or funnels?
- A: Click the Compare button to analyze two different product funnels side-by-side to see which performs better.
- Q: Can I filter the reports by product or revenue type?
- A: Yes! You can filter between all products, recurring, and non-recurring revenue, and even drill down into specific products with detailed revenue breakdowns.
Related Articles
- Just signed up? Watch this first.
- Dashboard and Business Insights (Legacy)
- Finding your customers & transactions