Gain a clear, data-driven view of your business performance with ThriveCart’s powerful dashboard, your business insights & prediction engine. Whether you’re using the legacy dashboard or exploring the new, graph-forward version (details found here), your ThriveCart dashboard makes it easy to visualize key ecommerce metrics like sales trends, revenue growth, and customer behavior.
With the ability to switch seamlessly between views, you’ll have all the tools you need to monitor performance, identify opportunities, and make smarter, more informed decisions for your business.
The Legacy Dashboard
This overview dashboard is the first thing that you’ll see when logging into your ThriveCart account, and you’ll be able to choose the Legacy dashboard (or switch to the new version) from the top of the page.
Your dashboard has several areas that allow you to navigate your account and view your sales analytics and revenue data that’s important to you.
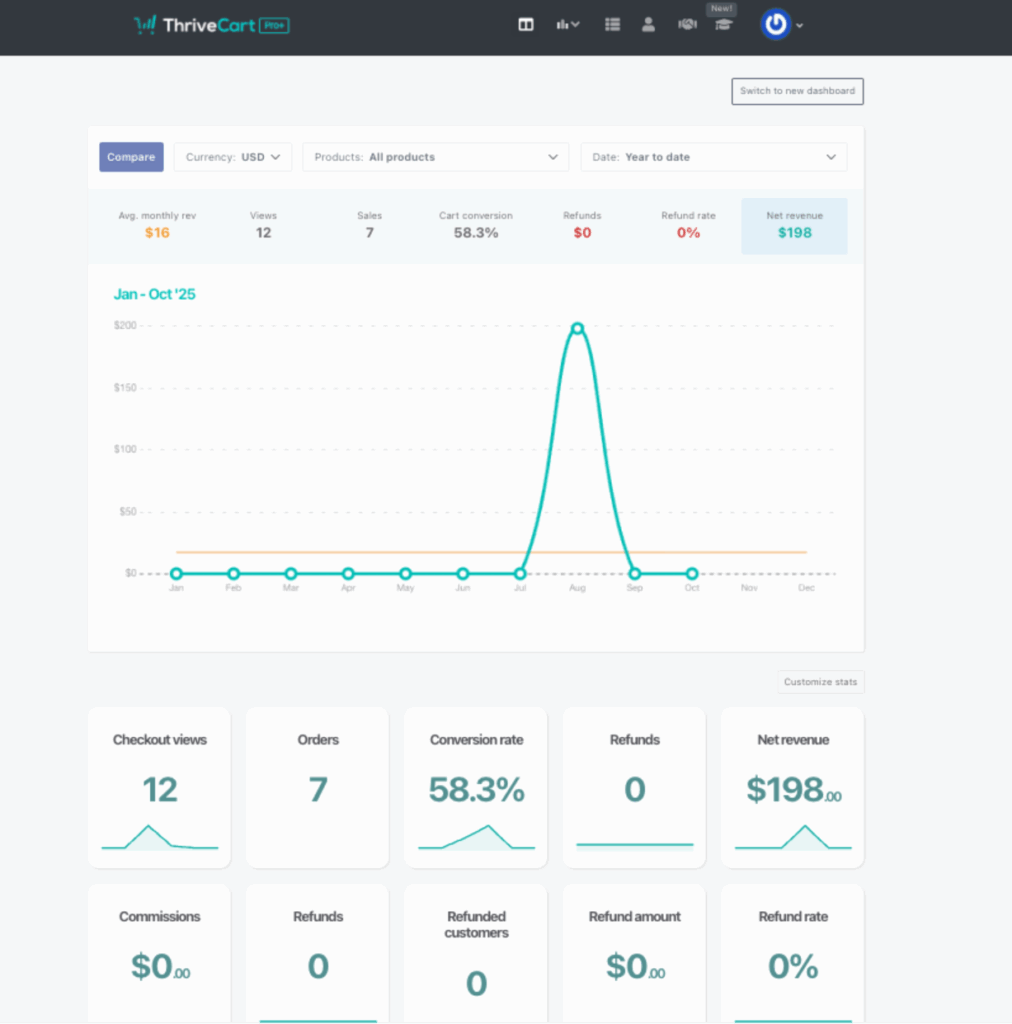
1. Your business insights & prediction engine
The forefront of your ThriveCart account is your very own revenue tracking dashboard.
This powerful dashboard lets you quickly and easily access key metrics about your business, letting you easily drill down on how your business and products are performing.
We display your data from all payment processors, with no limitations on time. Want to go back 3 years and check the performance of a product on a specific date or period? No problem.
You can even quickly and easily compare two points of data directly in your dashboard to see how they’re performing. Want to compare your best-selling product’s data from last month with this month to date? A couple of clicks and you can easily have this data at your fingertips.
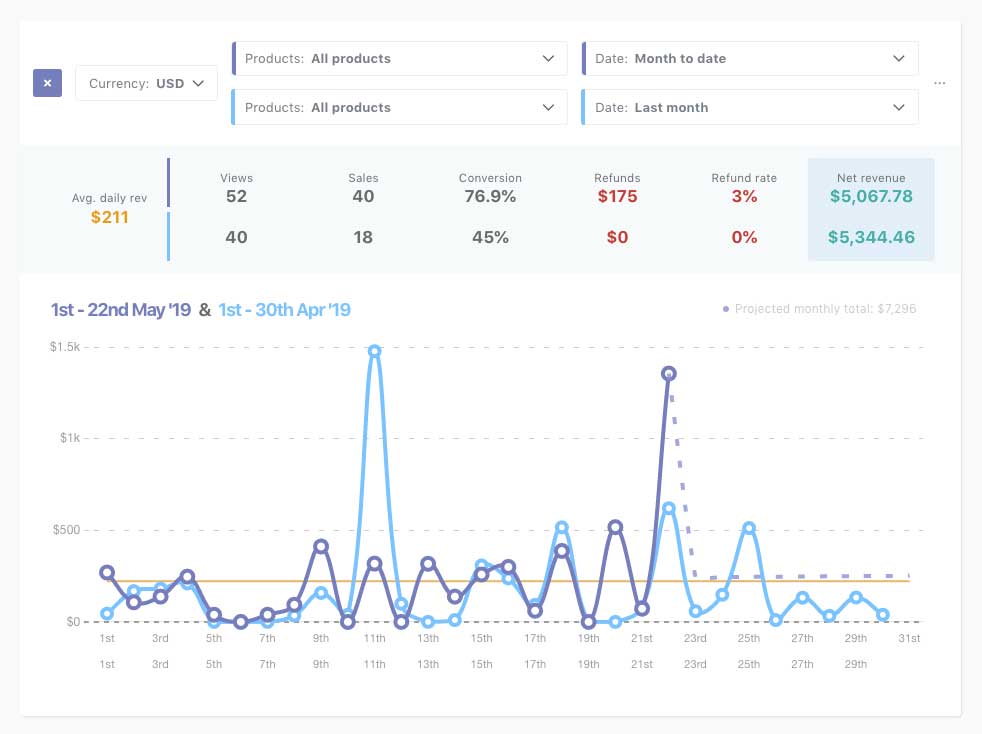
This also leads to our very own specialized prediction engine. Where you can see intelligent predictions of future revenue and different metrics. This system intelligently learns more about your business as more data is collected and updates automatically as time goes by.
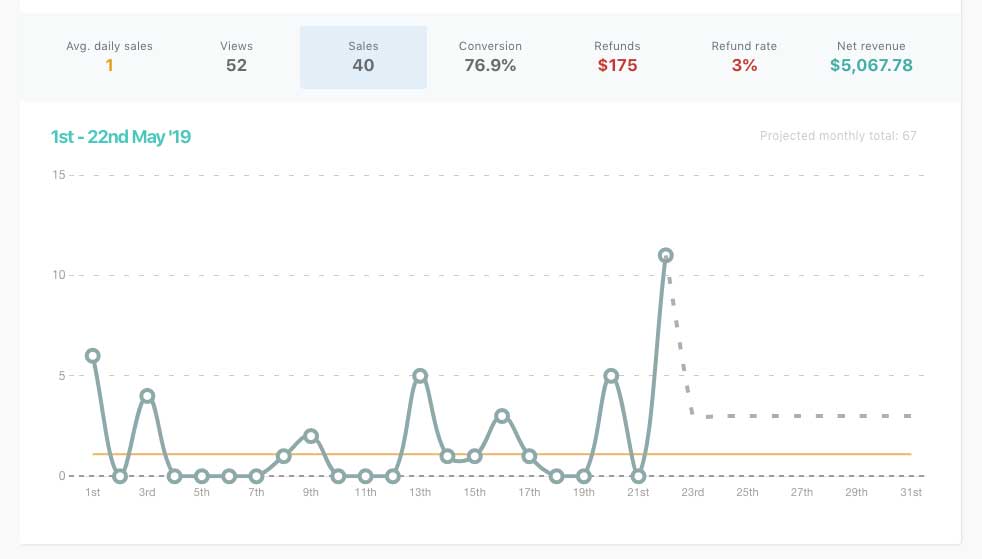
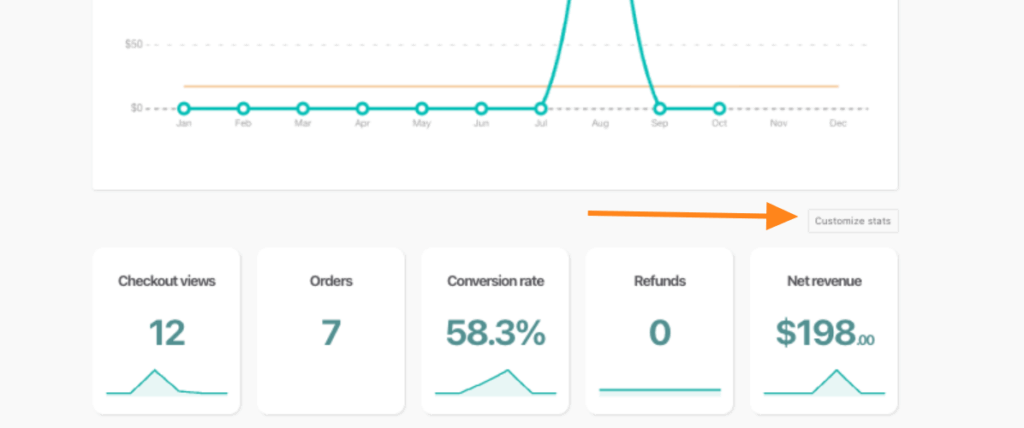
Each data point along the top can be individually selected and you can see statistics around the specific metric. Want to know the actual sales amounts (and view predictions)? Simply click the sales section to view this data.
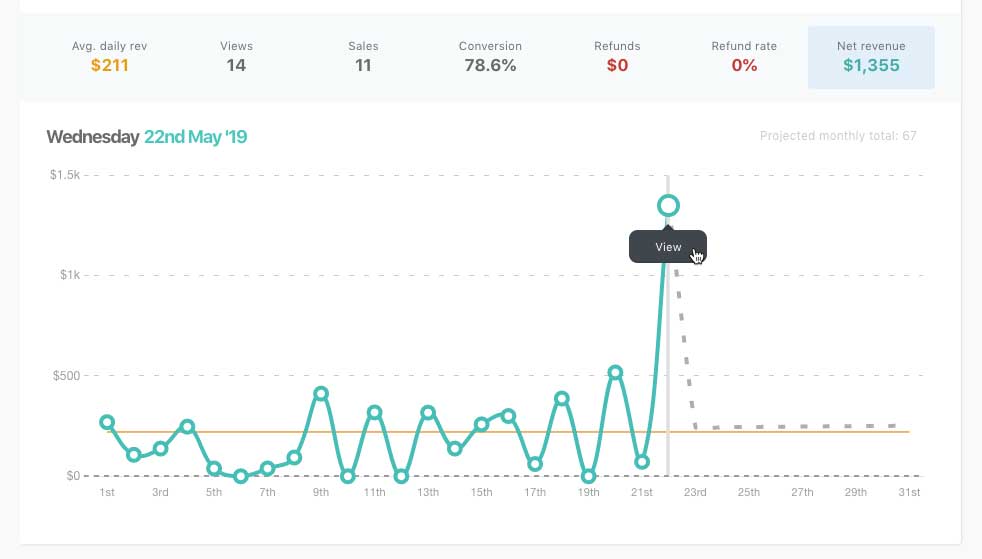
If you hover over a specific data point on the graph, the figures at the top will adjust to reflect that specific period. Also giving you the option to ‘view’ and get taken through to your transactions area for that date (or date period).
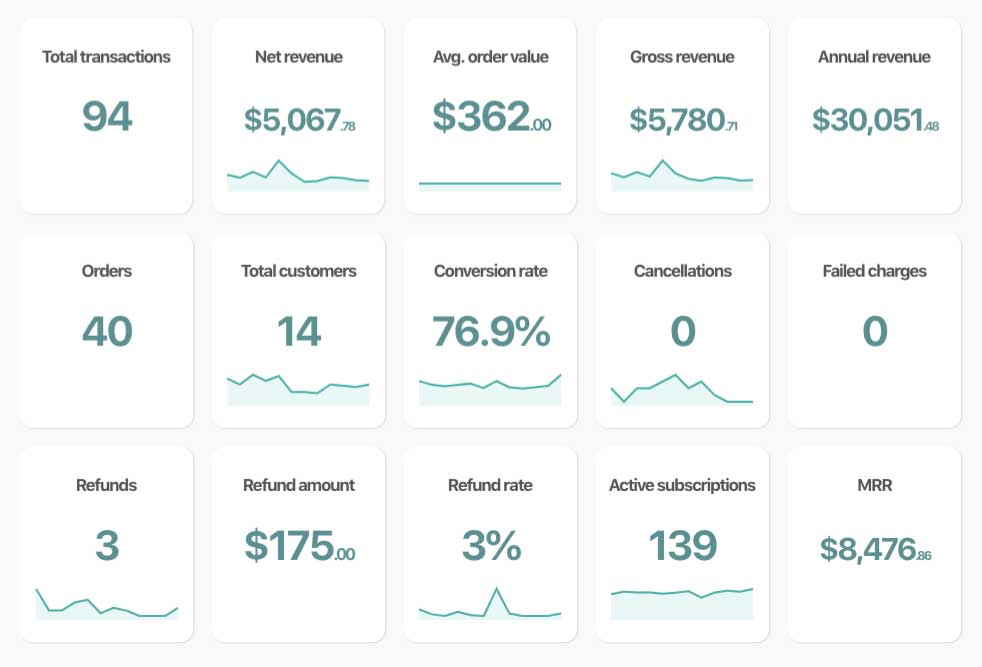
Finally, we have your business metrics and what’s really important to you. These tiles are customizable and movable.
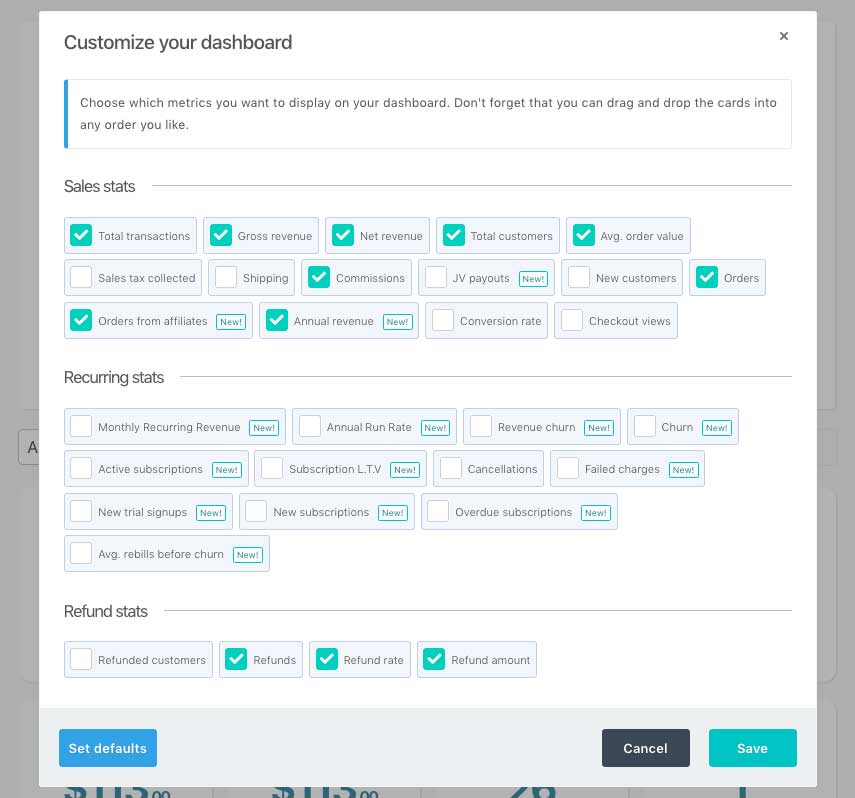
You’ll have access to a wide range of tiles which you can use to customize your ThriveCart dashboard, so you can see exactly what you need to when reviewing your account.
You can customize what data you see in your tiles by clicking “Customize stats” underneath your main graph.
Changing the order of your tiles is as simple as dragging & dropping them into their new position to make it easier to view the data that’s important to you.
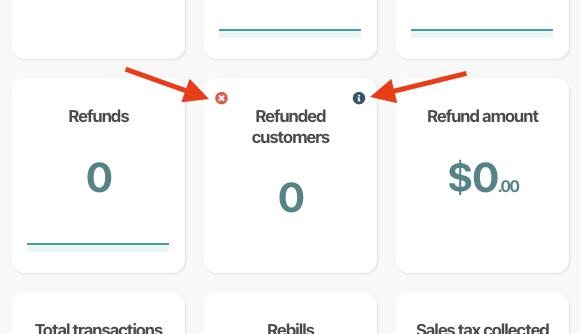
If you want to remove a tile from the dashboard, you can easily hover over it and click the X icon on the left. If you’re not sure how a specific statistic is calculated or what it means, you can also click the information icon on the right of the tile and it will flip to show you a description (clicking again will revert it).
2. Navigation

Your main navigation area can be seen at the top of your page, not just from this page, but from every page as you navigate your account. Within these tabs you can access:
- The main dashboard (stats/business insights)
- Deeper sales analytics (available with a Pro+ account)
- Your Products (which include upsells, downsells, split-tests, and coupons)
- Your transactions, subscriptions, and customers
- Partners area (including affiliates and the JV contracts functionality)
- Learn (your course management system)
- Under your profile image in the drop-down on the far right, you have additional options such as your profile information and access to your settings area. Note that your profile image is pulled in from Gravatar based on your account’s login email address
Related Articles
- Your Dashboard (the new dashboard)
- Just signed up? Watch this first.
- Finding your customers & transactions