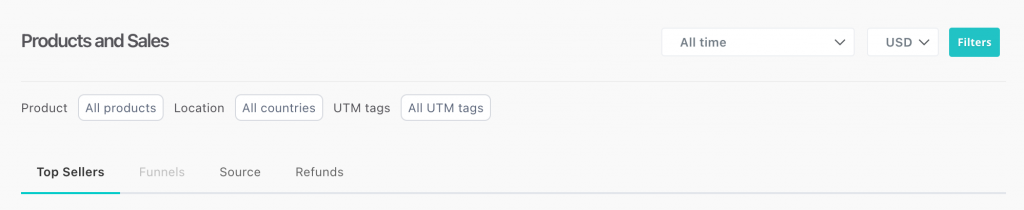
Build smarter strategies with Product & Sales Reports
ThriveCart Pro+ sales reporting transforms your raw data into real revenue insights. With a full dashboard of sales metrics, UTM tag performance, refund trends, affiliate insights and projections, you’ll have the clarity you need to optimize offers, double down on high-performers, and recover lost revenue.
Use advanced reporting tabs to break down the data by product, funnel, UTM, and more—then apply segmentation filters to drill into the details that matter most to your business.
Overview of Available Tabs
You’ll find four powerful tabs in your Product & Sales reporting area:
- Top Sellers
- Funnels
- Source
- Refunds
Top Sellers
See which products are driving the most revenue or orders across your account.
Metrics include:
- Main metrics/graph
- Top Sellers
- Top Coupons
- Top Affiliates
With product performance metrics displayed in the Top Sellers tab, you can quickly identify your highest-grossing products and analyze conversion rates to focus your efforts.
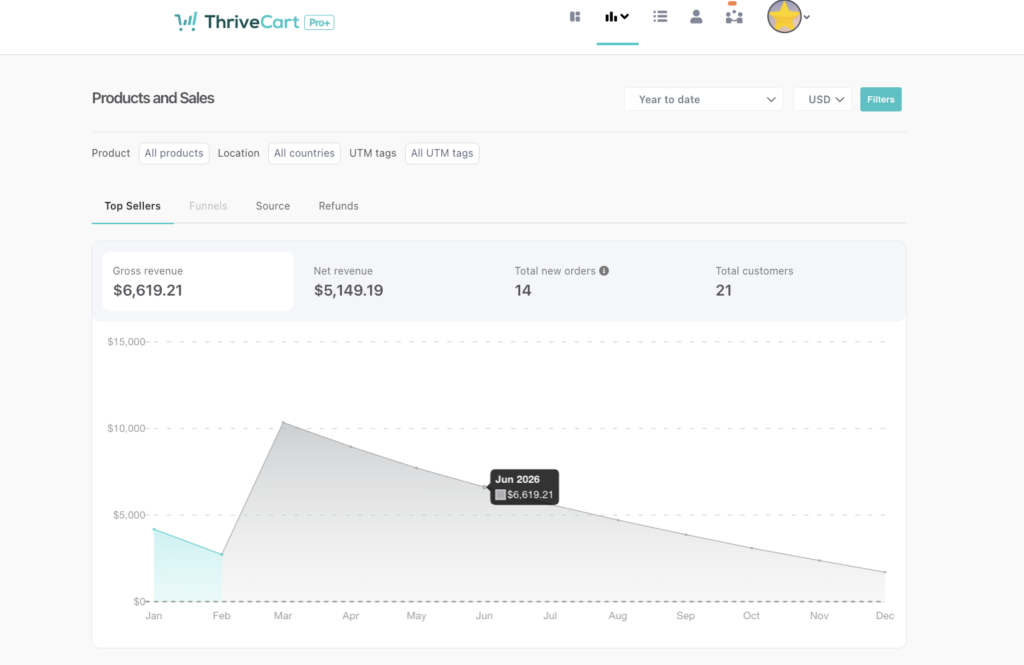
Main Metrics/Graph
The primary graph offers 3 metrics that you can click to see the performance of in the graph format based on your filtering options.
- Gross revenue – this is the total sale value for a product before any deductions (taxes, fees, refunds, discounts, shipping, chargebacks).
- Net revenue – this is taken by deducting any sales tax, shipping, affiliate commissions, and refunds from your Gross revenue.
- Total New Orders – this is the total number of orders processed within the timeframe based on any filtering options set – does not include rebill payments.
- Total customers – this is how many customers you have had. Note that customer stats won’t necessarily match your ‘orders’ and it’s not based on ’email’ address, if someone on the same device uses two different emails – it’ll assume these are both the same customer.

Top Sellers
The top sellers table will show the top 5 performing products in your account.
You can order this by number of orders, conversion rate, or gross revenue.
Top Coupons
The top coupons table will show the top 5 performing coupons in your account.
You can order this by number of sales, refund rate, or gross revenue.
Top Affiliates
The top affiliates table will show you the top 5 performing affiliates promoting products in your account.
You can order this by number of sales, gross revenue, conversion rate, and their refund rate.
Stats
Finally, we have a stats section covering:
- Total transactions – You can have multiple transactions in an order, rebills count as transactions, etc. This metric gives you the total number of transactions based on your filters.
- Total customers – A quick summary/repeat of the stat at the top of the page.
- New customers – The number of ‘new’ customers who have purchased from you based on your filters, excludes any existing customers who may have purchased new products.
- Gross revenue – This is the total revenue you’ve received from your customers.
- Pending revenue – If you have any revenue pending from non-instant payment methods, such as bank transfer, this’ll show here.
Funnels
View product-level performance within your funnels.
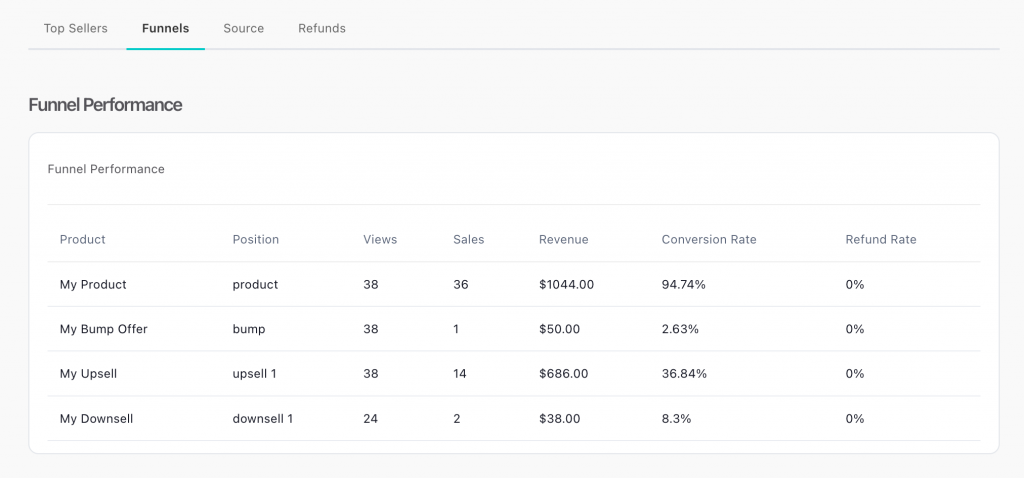
The Funnels tab further breaks down product performance metrics at each funnel step, giving you a clear view of your customer’s buying journey.
This tab will be disabled unless you have selected one product in your filters area. If you have selected one product, you’ll then be able to view this tab, and it’ll break down the products in your funnel and their individual performance.
Source
Gain insights into your traffic sources using UTM tracking reports (when UTM values are used in your checkout URLs), which allows filtering by UTM keys and identifying which campaigns drive the most revenue. This report includes:
- Sources
- Stats
- Territories
- Top 5 Territories
Sources
This covers your UTM tracking values. You can filter by specific UTM keys, and then see the top 5 values for that key.
You can filter this data to show which UTMs generate the most revenue or orders.
Stats
The metrics here cover:
- Checkout views – How many views your checkout(s) have received (based on your filtering options). These are not ‘unique’ views, but total views.
- Views from affiliates – If affiliates are promoting your product(s), this will confirm how many views your affiliates have sent your checkout pages (remember, your affiliate links may send traffic to a sales page before your checkout page, this tracks how many of those actually saw the checkout).
- New orders (previously Total Orders) – How many new orders you’ve processed – not including refunds
- Orders from affiliates – How many orders were referred from affiliates
Territories Breakdown
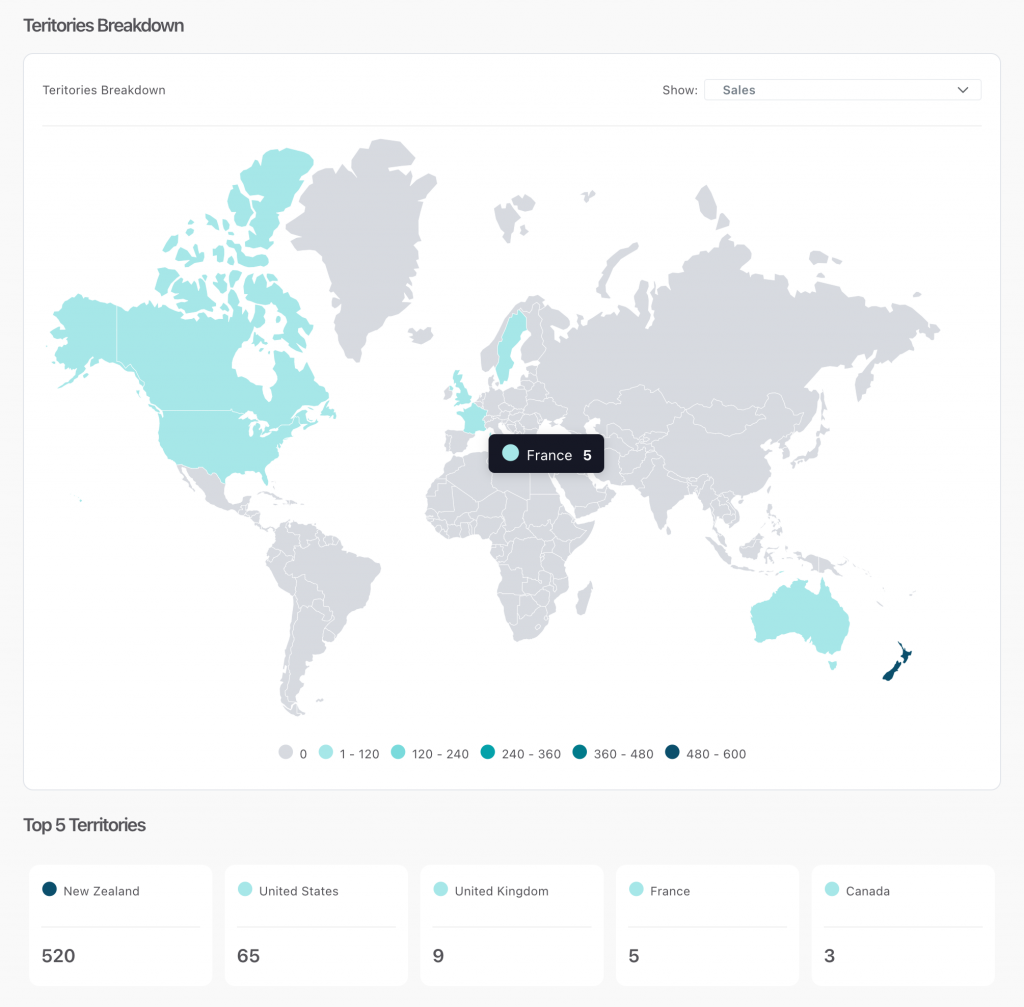
The territories breakdown is a world map letter you see how much revenue from from the different countries. The shade key in the footer shows at a glance which countries are performing best.
You can filter this chart to show country data based on gross revenue, net revenue, or sales.
Hovering your cursor over a country (with data) will show you a specific metric.
Top 5 Territories
Finally, the top 5 territories metric under the world map will update based on your filtering options for the chart and give you the details of the top 5 performing countries based on that filter option.
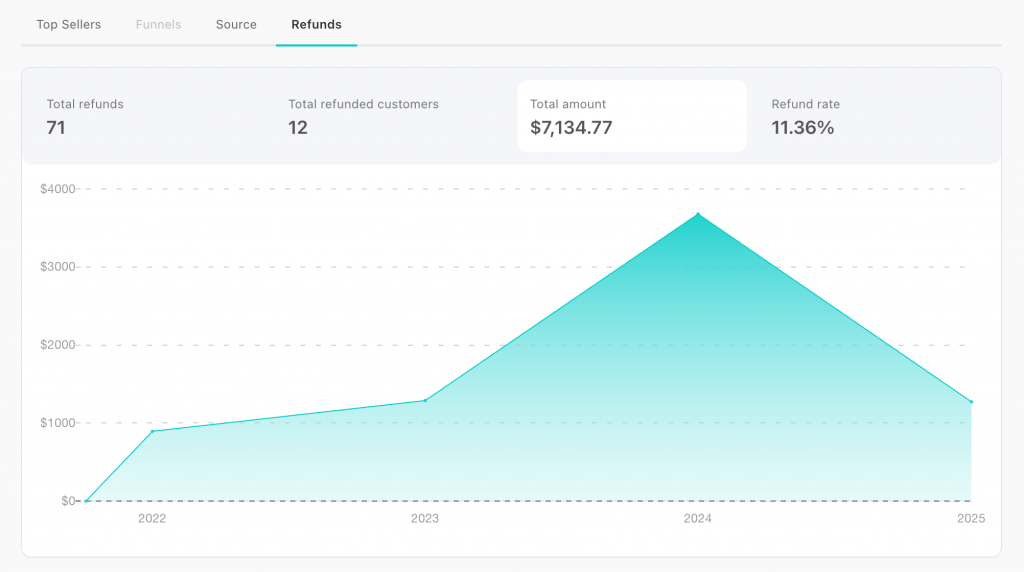
Refunds
Our refund analysis tools allow you to monitor refund trends, track total refunds and refund rates, and identify issues impacting your revenue.
This tab is broken down into the following sections:
- Main metrics/graph
- Cohort refunds
- Most refunded product
- Most refunded affiliate
Main Metrics/Graph
The interactive chart at the start of this page allows you to click through 4 different metrics and see that data in graph form, based on the filtering option set.
- Total refunds – This confirms the total number of refunds you’ve processed, a single order could have multiple refunds (if there are multiple transactions), or you could have issued multiple partial refunds on a single payment.
- Total refunded customers – This is how many customers you’ve refunded.
- Total refund amount – How much gross revenue you’ve refunded to customers.
- Refund rate – This is calculated based on how many refund transactions have been processed compared to the number of transactions in the selected period. For example, if you had 5 new purchase transactions and 3 rebills, then 2 refunds. That would be 2 transactions refunded from 8 total transactions, so a 25% refund rate.
Note: this refund rate is different from that of the refund rate in your transactions area. That area gives you a refund rate based on the monetary refund amount vs the gross revenue. For example, if you refund $47 and you’ve processed $354 in that period, that would be a 13.28% refund rate.
Cohort Refunds
With advanced refund analysis tools, you can assess refunds from specific customer cohorts and better understand the long-term impact of promotions on refunds.
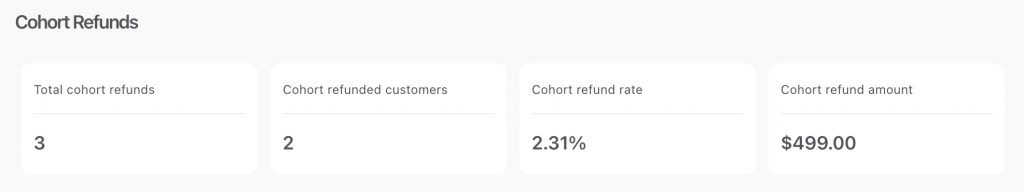
Cohort refunds are a great new set of metrics that let you see exactly how many customers who purchased during a set period of time refunded, even when the refund occurred outside of the selected time period.
This is especially useful for when you want to look back at a promotion after your refunded period has ended and see exactly how many of those customers ended up refunding.
If you’re running promotions, getting lots of customers, but a large portion of those customers actually end up refunding, knowing this can better help shape your future promotions.
For example
You run a promotion from the 5th of February to the 10th of February. During this time you onboard 60 new customers.
During the same time period, you issue 5 refunds to customers who purchased at the end of January.
Of the 60 new customers, you issued 3 refunds on the 8th February, and then 12 refunds between the 15th and 25th of February.
It’s now the end of the month, and you want to see how well your promotion did when it came to retaining customers.
Generally, looking back at the 5th to the 10th, you would see the 8 total refunds in that period, and that would be used to calculate your refund rate for that time.
However, with Cohort refunding, you’re specifically tracking the refund rate for the 60 customers who purchased during that promotion. Out of the 60 customers, a total of 15 refunds were issued, which resulted in a 25% refund rate for that customer cohort.
Most Refunded Product
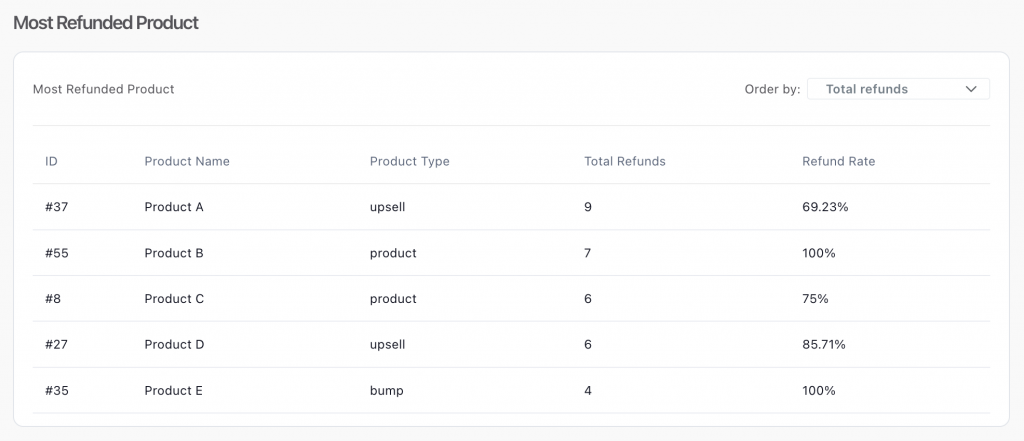
The most refunded product table will give you the top 5 products that have the most refunds.
You can order this table data based on the total number of refunds, or the refund rate.
Most Refunded Affiliate
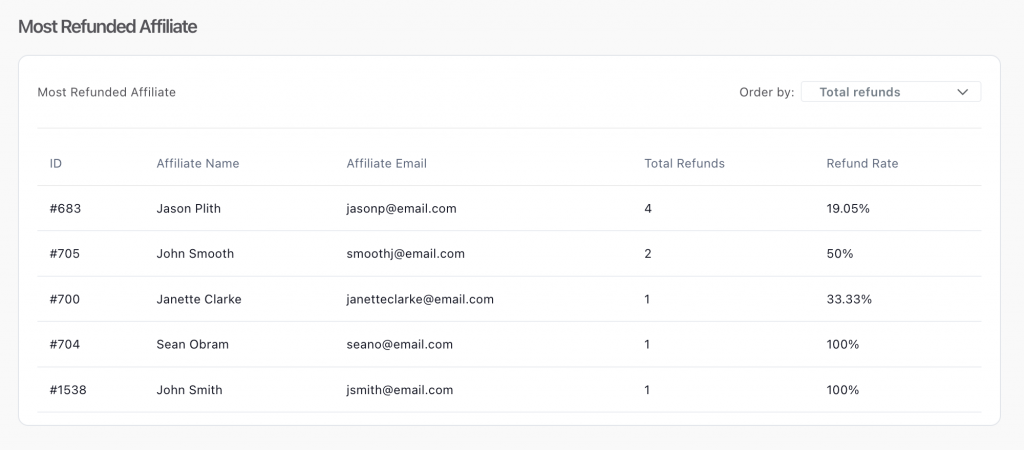
Similarly, you can use the most refunded affiliate table to see which of your affiliates are sending the most customers who ultimately refund.
You can order this table data based on the total number of refunds or the refund rate as well.
Projections
Want to get a sense of where your business is headed? ThriveCart Pro+ includes Projections across key metrics to help you anticipate future performance.
You can view projections for:
- Net Revenue
- Total New Orders
- Total Customers
These projections are available within your Product & Sales Reports and are shown directly in the primary graph.
To enable projections, simply select one of the following time filters:
- Week to Date – Shows data from Monday through today, with projections for the remaining days of the week.
- Month to Date – Displays data from the 1st of the current month, with projections through the end of the month.
- Year to Date – Shows performance from January to now, with projected data for the rest of the year.
- Current Financial Year – Similar to Year to Date, but based on your custom financial year start (set in Settings > Account-wide Settings > Finances).
Projections are displayed on the primary graph in the Top Sellers section of the Product & Sales report.
For example
If you’re viewing Number of Orders, and select a timeframe such as “Year to date” or “Month to date”, you’ll see your current data and projected values for future dates based on your selected time range.
The graph will extend beyond today, showing expected trends for the rest of the selected period.
Projections are only available in ThriveCart Pro+. If you’re not seeing this feature, make sure you’re using one of the supported time filters mentioned above.
Definitions + Further Clarification
- Gross Revenue: The total amount that the customer paid.
- Net Revenue: The amount that you earn as the vendor, after deductions or costs. Taxes and shipping are not considered in “net” as they are considered costs. Commission (affiliate or JV Partner earned commission) is also excluded from this net.
Example: if an order consisted of:
Product price $100 + Tax $20 + Shipping $10
Then on our end, the figures would be:
Gross = $130
Net = $100
- Total Transactions (Previously labeled “sales”): The sales value is counted based on transactions – this includes rebills as it’s money transacted
- New Orders (Previously labeled “orders”): The total number of new customer orders. This does not include rebills.
- Views: The total number of views based on your filters. Views are not unique, so a refreshed checkout page would count as 2 views.
Frequently Asked Questions (FAQs)
- Q: Why is the Funnels tab disabled for me?
- A: The Funnels tab is only enabled when a single product is selected in your filters. Select one product to view funnel-level performance.
- Q: How do I interpret the “Projections” graph?
- A: Projections extend your current data (e.g., revenue, orders) based on selected time filters (Week, Month, Year to Date) and help forecast performance. This are purely speculative based on your current processing values and active subscriptions charging as expected.
- Q: What is the difference between Refund Rate and Cohort Refund Rate?
- A: Refund Rate shows refunds vs total transactions for a time range; Cohort Refund Rate measures how many customers from a period eventually refunded.
- Q: How do UTM Tracking Reports function in ThriveCart Pro+?
- A: UTM Tracking Reports in ThriveCart Pro+ provide detailed source tracking based on URL variables added to your checkout URLs, but require Stripe Connect+ enabled on your products to display accurate data.
- Q: I used to track the “Sales” datapoint, where has that gone?
- A: As of February 2026, this has been updated to “Total Transactions” in order to more clearly define the data presented. The actual data stayed the same, as it always included all payments (upsells, rebills, etc.) and not just new orders.
Related Articles
- Setting a Timezone for Your Account Reporting
- Stripe Connect+ Setup Process (the latest version)
- What is ThriveCart Pro+?