See beyond single-product stats and start understanding your entire customer journey. With Funnel Comparison Reports in ThriveCart Pro+, you can measure performance across every stage of your funnel, from first click to final upsell, and uncover exactly what drives your highest conversions and revenue growth.
See your entire sales process with total clarity. ThriveCart’s Funnel Comparison Reports transform raw data into strategic insight, helping you pinpoint which funnels convert best, which audiences respond most, and where your revenue potential lies. Whether you’re optimizing lead magnets, upsell flows, or full campaigns, these reports turn analytics into action.
Make smarter, faster decisions with funnel-level performance insights
With Pro+, you can dive deep into how each of your funnels performs across time, audience segments, and campaign types. Whether you’re refining your lead generation strategy, adjusting retargeting efforts, or optimizing ad spend, Funnel Comparison Reports give you precise visibility into what’s driving growth and where to focus next.
From high-level metrics to detailed product-by-product breakdowns, it’s never been easier to measure and manage your entire sales ecosystem in one place.
What You Can See
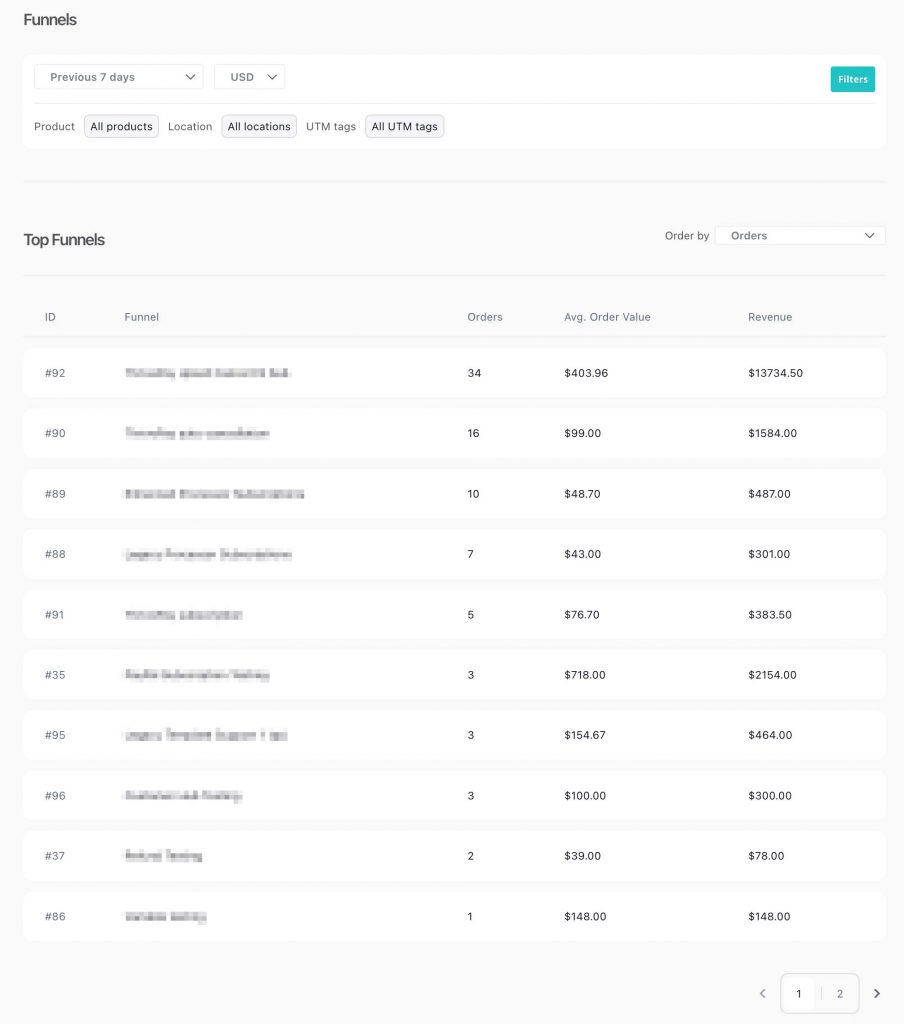
Your Funnel Reports give you an instant overview of the key metrics that matter most, including:
- Total revenue and total orders for each funnel
- Average Order Value (AOV) to gauge per-sale efficiency
- Performance over time to identify growth or drop-off trends
- Comparisons across products, campaigns, UTM tags, and locations to see what’s truly working
You can filter by date range, product, location, or UTM tags, and sort your funnels by orders or revenue to highlight your best performers in seconds.
Example Use Case
Want to see which funnels perform best in a specific country? Apply a country filter and instantly compare the results. You can then shift ad spend, refine local messaging, and replicate high-performing strategies across other regions. These insights are designed to help you build stronger funnels, validate the impact of features like Multiple Order Bumps, and make data-backed decisions that drive real, sustainable growth.
These insights are designed to help you build stronger funnels, validate the impact of features like Multiple Order Bumps, and make data-backed decisions that drive real, sustainable growth.
Why It Matters
Every sale tells a story, and Funnel Comparison Reports make sure you’re reading it right. By visualizing performance at the funnel level, you’ll uncover patterns in customer behavior, pricing sensitivity, and conversion flow that traditional reports often miss.
Armed with this data, you can:
- Identify high-performing funnels faster
- Compare campaign efficiency across different channels
- Optimize creative assets based on conversion data
- Scale profitable funnels and sunset underperforming ones
Take Action on Your Insights
Funnel Comparison Reports empower you to move from reactive to proactive growth. Instead of guessing what’s working, you’ll know exactly where to allocate time, budget, and creative energy for maximum return.
Frequently Asked Questions (FAQs)
- Q: Where do I access Funnel Comparison Reports in ThriveCart?
- A: You can access them directly from your ThriveCart dashboard under the reporting section, once you have Stripe Connect+ enabled and applied to the products in your funnel.
- Q: What metrics can I compare between funnels?
- A: You can see total revenue, total orders, average order value (AOV), performance trends over time, and breakdowns by product, UTM tag, campaign, or customer location.
- Q: Can I filter funnel data by location or campaign source?
- A: Yes. You can apply filters such as country, product, or UTM values to analyze funnel performance by geography, traffic source, or campaign.
- Q: Do I need Stripe Connect+ enabled to use Funnel Comparison Reports?
- A: Yes. This feature is only available to Pro+ users and requires Stripe Connect+ to be enabled and active on the relevant products in your funnel.